

Say Goodbye to Aggregate Metrics: Track Your Time-Series Predictions over Time
Say Goodbye to Aggregate Metrics: Track Your Time-Series Predictions over Time
Get insights into your forecasting model with Krisi and be aware of regime changes


Tracking metrics over time is critical to ensure that time-series prediction models remain accurate and reliable. That's why we're thrilled to introduce Krisi, an advanced library that makes it easy to track the performance of time-series predictions over time.

Why measuring performance over time is crucial
Tracking forecast performance over time provides a more accurate measure of the reliability of predictions: it becomes possible to detect any inconsistencies in the predictions.
For example, suppose a business forecasts a gradual increase in sales over a quarter. The actual sales might show a sharp increase in the first month and then stagnate in the subsequent two months. In such a scenario, collapsing the forecast to a single value would mask where the inaccuracy in the predictions happened. Tracking performance over time would allow the business to identify and investigate the discrepancies in the forecast, leading to improved decision-making.
Regime changes happen often. By monitoring the performance over time it is easier to choose and compensate for the model's shortcomings. It is also easier to identify when a model is becoming outdated or no longer effective.
More importantly, if you don’t have access to how the model was performing, it will be hard to debug. One might throw away a valid model that behaves badly in certain regimes but very strongly in others (for example in high volatility periods vs in low volatility periods).
Collapsed metrics vs metrics over time
To illustrate the importance of tracking metrics over time, let's consider an experiment conducted (colab) using Prophet. In the first experiment, Prophet was used with a single train-test split, and its predictions were evaluated both overall and tracked over time. In the second experiment, Prophet was used with an Expanding Window Splitter, in which the model was retrained every day. The graph below shows the results of the two experiments:

They seem pretty close! Let’s check with Krisi how the RMSE score has changed over time, to double check if our results are valid:
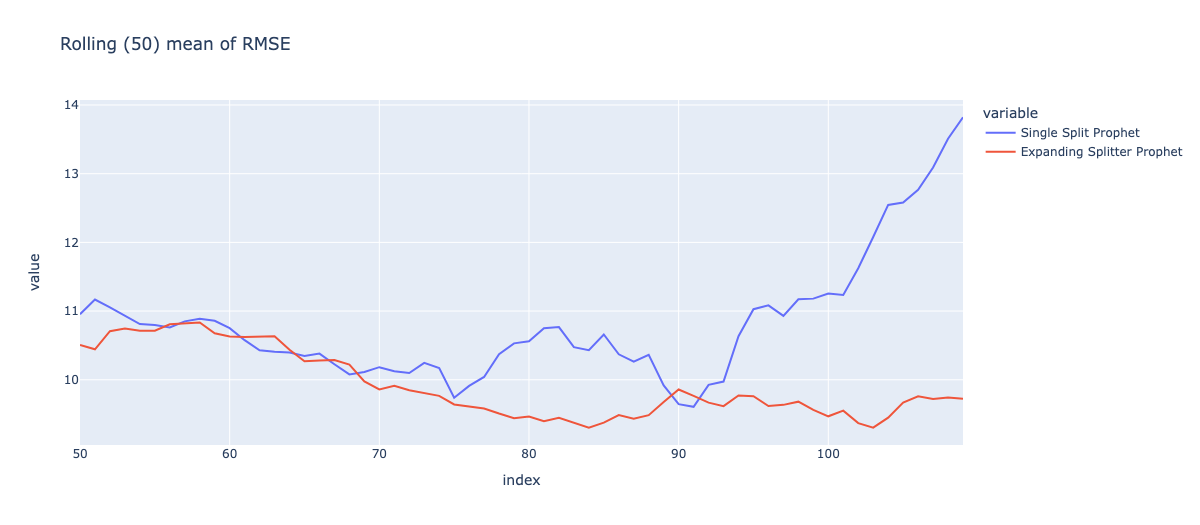
As you can see from the graph, in the first experiment, the Root Mean Squared Error (RMSE) gradually increased over time, indicating that the model's accuracy decreased as time progressed. On the other hand, in the second experiment, the RMSE remained relatively constant over time, indicating that the model's accuracy remained stable.
This result highlights the importance of tracking metrics over time and demonstrates how Krisi can be used to ensure that time-series prediction models remain accurate and reliable over extended periods. If we only used the single point metric, we would not have spotted this diversion. Check the full experiment rundown on colab, all training was done with our Adaptive Machine Learning library Fold.
Krisi packs useful features
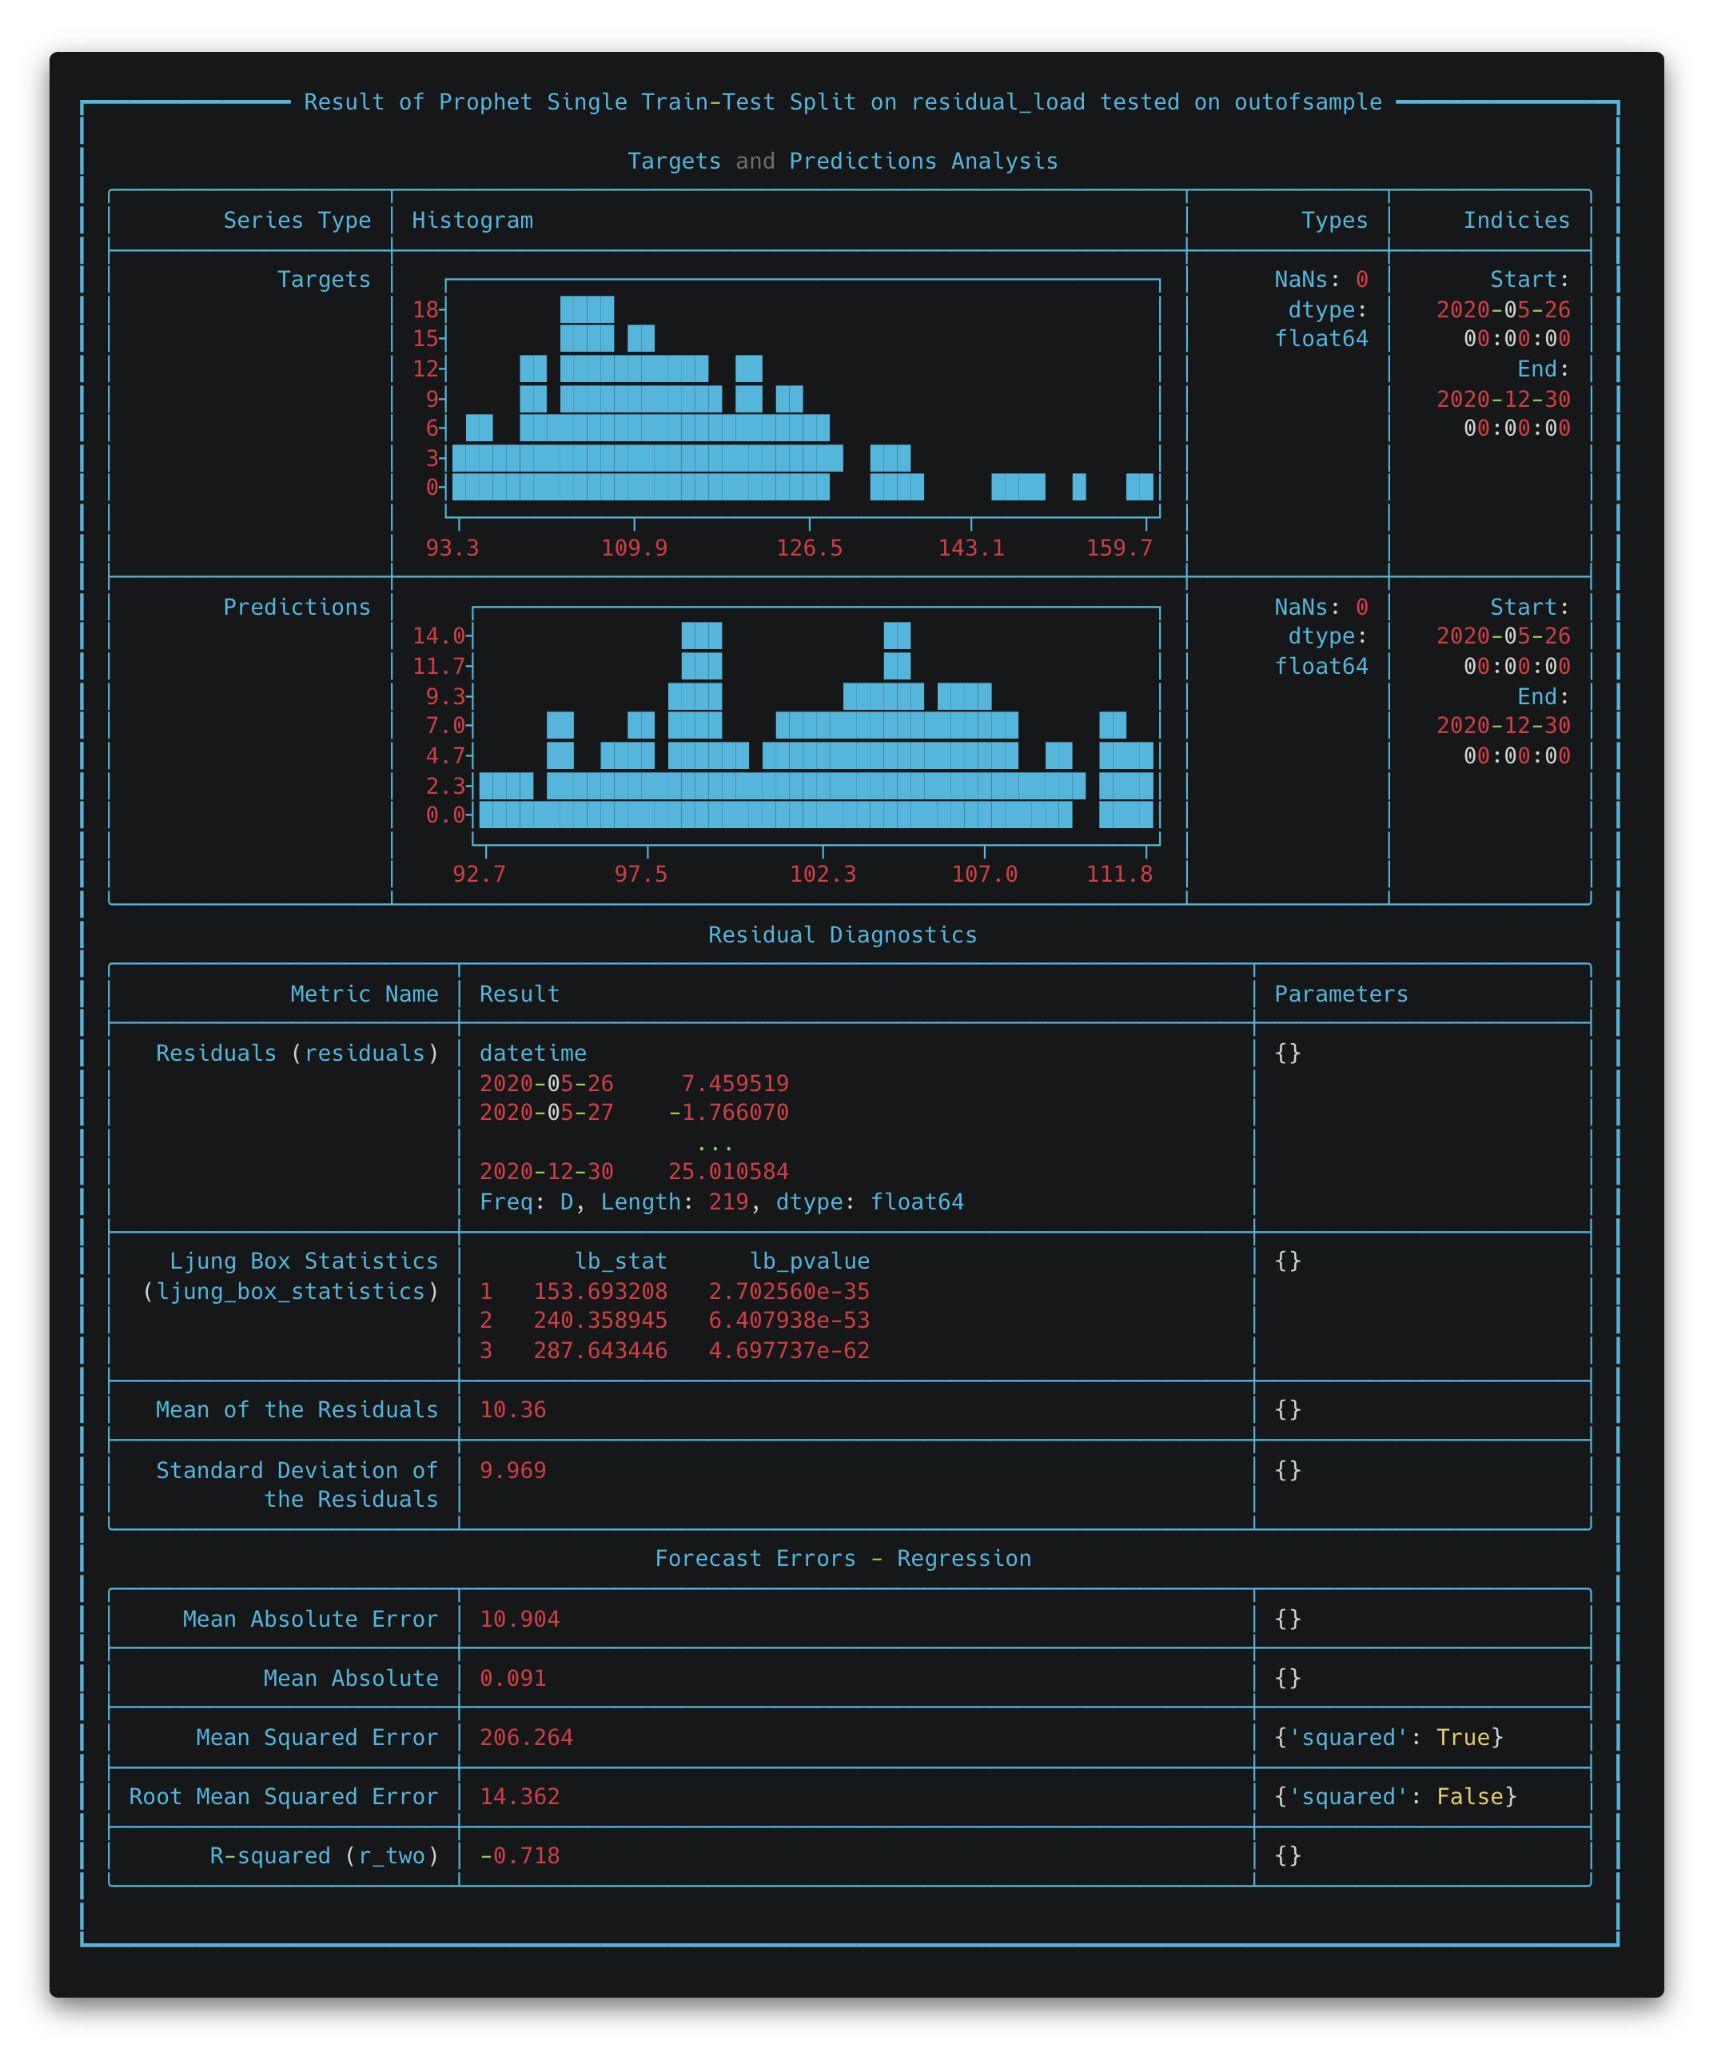
By tracking metrics over time, Krisi also makes it easy for users to create reports that can be shared with stakeholders. Reports can be generated in PDF or interactive HTML formats, making it easy to communicate the performance of time-series prediction models to other team members or clients. Krisi also prints reports directly to the console, enabling users to quickly and easily view the results of their analyses.
Moreover, Krisi is highly customizable and makes it easy to add new metrics to tailor the library to specific use cases. This is critical because it enables users to track the metrics that matter most to them and their specific application.

Try out Krisi!
In conclusion, Krisi is an essential tool for anyone who relies on time-series forecasting models. By tracking metrics over time, generating customizable reports, and being highly flexible, Krisi offers users the tools they need to ensure that their models remain accurate and reliable. We encourage users to try Krisi and discover the benefits of tracking metrics over time for themselves.
Try Krisi here! Check out a walkthrough here.